⛳ Arco Verde is situated in or near the subtropical dry forest biome.
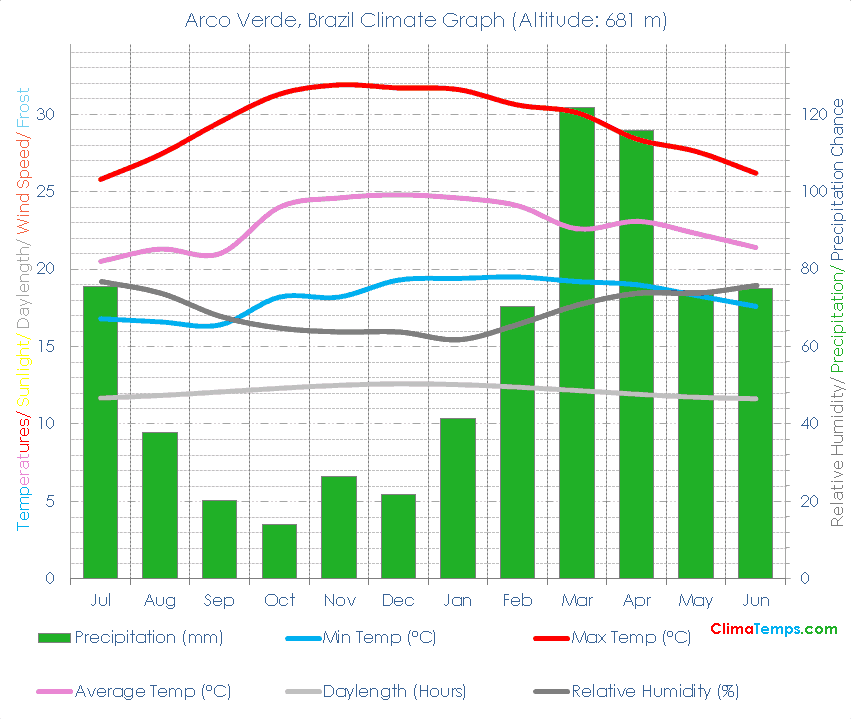
🌡️ The annual mean temperature is 22.9 degrees Celsius (73.2 degrees Fahrenheit). See the temperatures page for a monthly breakdown and the fixed scale graph.
🐬 Average monthly temperatures vary by 4.3 °C (7.7°F). This indicates that the continentality type is hyperoceanic, subtype truly hyperoceanic.
☔ Total annual precipitation averages 694.2 mm (27.3 inches) which is equivalent to 694.2 Litres/m² (17.03 Gallons/ft²).
Simply paste the following HTML code into your webpage. Please include a link back to this website. There is one in the following code already. Edit the width attribute to change the size of the graph if needed:
✨ The longest day of the year is 12:29 long on the 21 of December and the shortest day is 11:30 long on the 22 of June.
🐇Were you to burrow down through the centre of the Earth from Arco Verde you would pop up nearest to the climate station at Yap Island/ Caroline Islands, Micronesia where you would find a Tropical wet climate.
🌍Arco Verde, Brazil is at 8°25'S, 37°5'W, 681 m (2234 ft). Check the location on the map.
| Climate Variable | Jul | Aug | Sep | Oct | Nov | Dec | Jan | Feb | Mar | Apr | May | Jun | Annual | ||
|---|---|---|---|---|---|---|---|---|---|---|---|---|---|---|---|
| Average Max Temperature °C ( °F) | 26 (78) | 27 (81) | 30 (85) | 31 (88) | 32 (89) | 32 (89) | 32 (89) | 31 (87) | 30 (86) | 28 (83) | 28 (82) | 26 (79) | 29 (85) | ||
| Average Temperature °C ( °F) | 21 (69) | 21 (70) | 21 (70) | 24 (75) | 25 (76) | 25 (77) | 25 (76) | 24 (75) | 23 (73) | 23 (74) | 22 (72) | 21 (71) | 23 (73) | ||
| Average Min Temperature °C ( °F) | 17 (62) | 17 (62) | 16 (62) | 18 (65) | 18 (65) | 19 (67) | 19 (67) | 20 (67) | 19 (67) | 19 (66) | 18 (65) | 18 (64) | 18 (65) | ||
| Average Precipitation mm (in) | 75 (3) | 38 (1) | 20 (1) | 14 (1) | 27 (1) | 22 (1) | 42 (2) | 70 (3) | 122 (5) | 116 (5) | 74 (3) | 75 (3) | 694 (27) | ||
| Average Daylight Hours/ Day | 11h 40' | 11h 50' | 12h 04' | 12h 18' | 12h 30' | 12h 35' | 12h 32' | 12h 23' | 12h 09' | 11h 55' | 11h 43' | 11h 38' | 12h 00' | ||
| Sun altitude at solar noon on the 21st day (°). | 61.1 | 69.6 | 80.8 | 85.5 | 78 | 75 | 78.3 | 86.1 | 81.1 | 69.6 | 61.3 | 58.2 | 73.6 |
Please take a moment to share a climate graph or simply the address:
Thank You, so much! ❤️